Every year after NIRF results are announced, a handful of institutions issue press releases celebrating dramatic rank improvements. "Jumped 60 positions." "Broke into the top 100 for the first time." "Fastest-rising institution in the region."
The press release always credits visionary leadership, strategic investment, and institutional commitment. It never mentions what actually happened.
We decided to find out.
What we analysed
Edhitch maintains a proprietary NIRF dataset covering 7 consecutive years of NIRF results across all 13 disciplines. The dataset contains 5,076 institution-year records, built through OCR extraction of NIRF's published results and manual verification. It is, to our knowledge, the most comprehensive longitudinal NIRF dataset outside of NIRF itself.
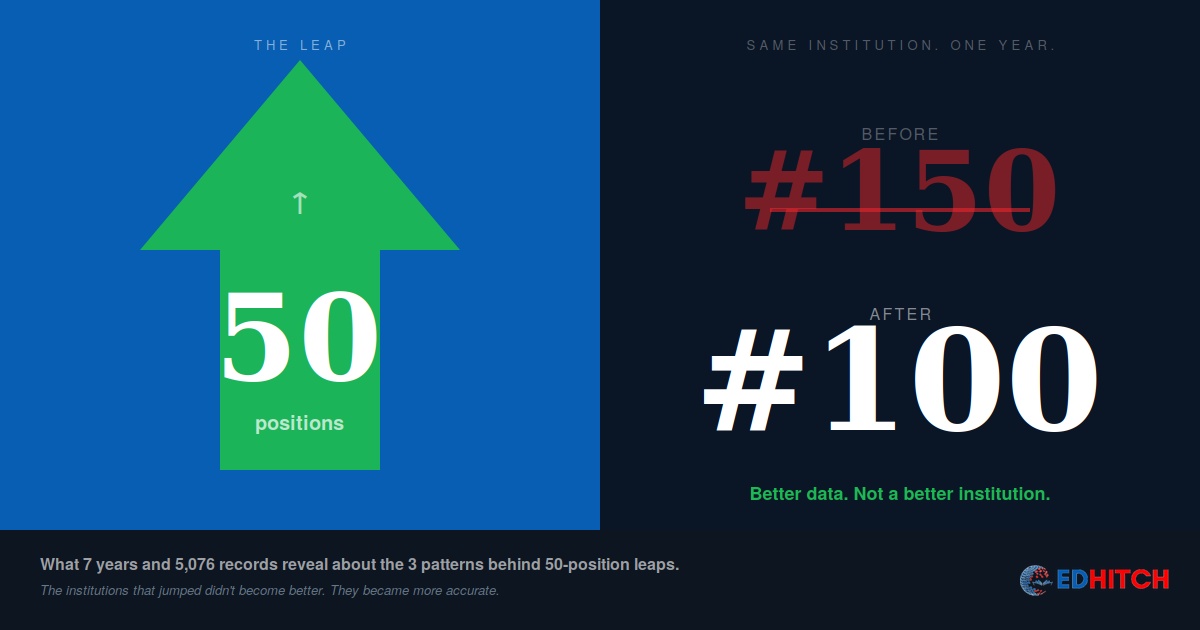
We used this dataset to identify every instance where an institution jumped 50 or more positions in a single year. Then we examined what actually changed in each case — not the press release narrative, but the parameter-level score movements that explain the rank change.
Three patterns emerged. None of them are what the brochures claim.
Pattern 1: Data correction — the single largest driver of rank jumps
The most common cause of a 50+ position jump is not institutional improvement. It is data correction — the institution fixed how it reported data to NIRF, not what the institution actually did.
The typical pattern: an institution that underreported in Year 1 (uncorrected Scopus affiliations, unreported patent grants, narrow placement definitions, FRU misclassification) submits corrected data in Year 2. The institutional reality didn't change between years. The data translation improved.
This is consistent with everything we see in our advisory work. Institutions that are strong but whose data is weak have the highest latent potential for rank movement — because the gap between their actual performance and their NIRF-reported performance is recoverable. The marks were always there. They just weren't claimed.
The institutions that jumped furthest didn't become better. They became more accurate. That's not a criticism — it's a diagnostic insight. If your institution is genuinely good and your rank doesn't reflect it, the problem is almost certainly data translation.
Pattern 2: Denominator management — the ratio game
NIRF scores are built on ratios: publications per faculty, expenditure per student, placement per graduate, women per total students. The numerator gets all the attention. The denominator does all the work.
Institutions that grew rapidly — adding students, programmes, and campuses — often saw their ranks drop despite absolute improvement, because the denominator grew faster than the numerator. The institutions that jumped upward often did the opposite: they controlled growth while improving output, which improved the ratios even without dramatic institutional change.
This isn't gaming the system. It's understanding the system. NIRF measures efficiency, not scale. An institution with 80 faculty and 200 publications (2.5 per faculty) scores higher on RP-PU than an institution with 150 faculty and 300 publications (2.0 per faculty) — even though the second institution publishes 50% more papers.
Spending more doesn't move the rank if the ratio doesn't improve. The institutions that jumped understood this.
Pattern 3: Parameter concentration — the 2-3 sub-parameter strategy
NIRF has 5 parameters and roughly 15 sub-parameters (varying by discipline). Institutions that try to improve across all 15 simultaneously improve none of them meaningfully. Institutions that made large jumps typically concentrated effort on 2-3 specific sub-parameters where they had the largest gap with the institutions ranked directly above them.
The logic is simple. If you're ranked 150th and the institution at 100th beats you on RP-PU (35 marks in Engineering) by 12 points but only beats you on OI-ESCS (20 marks) by 2 points, closing the RP-PU gap moves you more than closing the OI-ESCS gap. But most institutions don't know this — because they don't have parameter-level comparisons with specific peer institutions.
The institutions that jumped had this data. They knew exactly where they were losing and to whom. They didn't improve blindly. They improved surgically.
The institutions that climb don't work harder than everyone else. They know exactly which 2-3 numbers to move — and they move them. Everything else is noise.
What the data doesn't show — and why that matters
Our dataset reveals rank movements and parameter-level score changes. It does not reveal internal institutional decisions — we don't know whether a VC consciously pursued a data correction strategy or whether an enterprising NIRF in-charge simply did a better job filling the portal.
This distinction matters because most rank jumps are not the result of strategic planning. They're the result of one person in the IQAC or NIRF committee doing their job more carefully than their predecessor. The institution gets a rank jump and the VC takes credit for "strategic investment in quality." The actual cause was a coordinator who checked the Scopus affiliations.
This is why rank movement is not predictive. An institution that jumped 50 positions last year through data correction is unlikely to jump another 50 next year — because the correction was a one-time fix. The institutions that sustain movement are the ones that build data discipline as a permanent capability, not a one-time project.
What this means for your institution
If your rank is lower than your quality deserves, the most likely cause is data translation — not institutional weakness. Start with a parameter-by-parameter audit of your last DCS submission and identify where your reported scores diverge from your actual performance.
If your rank is stagnant despite investment, you're probably improving across all parameters equally — which means you're improving at the same rate as your peer group. Identify the 2-3 sub-parameters where you have the largest gap with the institutions ranked 20-30 positions above you, and concentrate there.
If you want to benchmark against specific peers, you need longitudinal data — not just this year's rank, but how peer institutions' parameter-level scores have moved over 3-5 years. That's the dataset we've built. And it's becoming available.
Edhitch NIRF Intelligence — Early Access
Our 7-year NIRF dataset covering 5,076 institution-year records across 13 disciplines is the foundation of Edhitch NIRF Intelligence — a paid research subscription launching Q3 2026 for institutions, investors, and researchers tracking Indian higher education. Institutional benchmarking, peer comparison, parameter-level trend analysis, and score prediction.
Join the Waitlist →In the meantime, our NIRF Diagnostic is a four-week, parameter-by-parameter analysis of your DCS submission using this dataset for benchmarking. Learn more →
Frequently Asked Questions
Can institutions really jump 50 positions?
Yes — but the cause is almost always data correction and reporting accuracy, not institutional transformation. The quality was already there. The data reporting wasn't capturing it.
What data did Edhitch analyse?
5,076 institution-year records across 13 NIRF disciplines, covering 7 consecutive years (2019-2025). Built through OCR extraction and manual verification. This is the foundation of Edhitch NIRF Intelligence.
What are the three patterns behind large rank jumps?
Data correction (fixing reporting accuracy), denominator management (controlling ratios rather than just growing numerators), and parameter concentration (directing effort to the 2-3 sub-parameters with the largest peer gap).
What is Edhitch NIRF Intelligence?
A paid research subscription launching Q3 2026. Institutional benchmarking, peer comparison, parameter-level trend analysis, and score prediction — built on the 7-year dataset.
How can I benchmark my institution now?
Our NIRF Diagnostic provides parameter-by-parameter analysis of your DCS submission with peer benchmarking from the dataset.
Related Reading
- We Improved Everything. Our NIRF Rank Dropped. What Happened?
- The Institution Was Strong. The Data Was Weak.
- NIRF 2026 Has Closed. Here's What Your Submission Tells You.
- ₹50 Crore Spent. NIRF Rank Didn't Move. Why?
- 82% Placement. Low NIRF GO Score. Why?
- NAAC vs NIRF vs NBA: 68% Overlaps — One Strategy, Not Three
Edhitch
Accreditation & Ranking Intelligence · NAAC · NBA · NIRF · 12 Years · 100+ Institutions