A private engineering college in Tamil Nadu had 340 Scopus-indexed publications over three years. Respectable output for an institution of its size. Yet its RP score was in the bottom quartile of ranked institutions. The Dean's explanation: "We publish well. NIRF just doesn't recognise our work."
He was partly right — but not in the way he thought. NIRF did recognise publications. What it didn't recognise were the 87 publications where faculty had listed personal email affiliations instead of the institutional affiliation in Scopus. Those papers existed in the real world but not in NIRF's third-party data. They were invisible to the ranking.
This is the pattern we see across RP: institutions that do good research but lose marks on how that research is captured, reported, and attributed in the databases NIRF actually queries. The marks aren't lost on research quality. They're lost in the gap between research activity and research data.
RP carries the same weight as TLR — but gets a fraction of the attention
For Engineering institutions, RP carries 30% of the total NIRF score — identical to TLR (Teaching, Learning & Resources). Yet in our experience, institutions spend 80% of their NIRF preparation time on TLR (faculty recruitment, infrastructure, student-faculty ratio) and treat RP as something that "will improve as research culture grows."
This is a strategic miscalculation. TLR improvements require significant investment — hiring faculty, building infrastructure, admitting PhD students. RP improvements require a mix of genuine research growth and data accuracy — and the data accuracy part can often be addressed in months, not years.
An institution that fixes its Scopus affiliations, properly reports its patents, and accurately captures its consultancy income in the DCS can recover 5-15 RP marks without publishing a single additional paper. That's because those marks were already earned through research activity — they were just lost in the reporting.
PU (35 marks): Publications per faculty — and the FRQ trap
PU measures the weighted number of publications normalised by FRQ — the Faculty Reference Quantity. The formula: PU = 35 × f(P/FRQ), where P is the publication count from third-party sources and FRQ is the greater of the nominal faculty (at 1:15 student-faculty ratio) or the actual faculty count.
The FRQ denominator is where many institutions lose marks without understanding why. If an institution has 100 actual faculty but its student strength implies a nominal faculty of 130 (at 1:15 ratio), FRQ becomes 130 — and every publication is divided by 130, not 100. The institution's per-faculty publication rate appears lower than its actual faculty would produce.
The trap works in the other direction too. Hiring more faculty improves your student-faculty ratio (a TLR metric) but increases FRQ, which can dilute your per-faculty publication rate (an RP metric). Institutions that hire faculty without simultaneously increasing research output may see their TLR score improve while their PU score drops. One parameter's gain becomes another parameter's loss.
The 2025 framework also deducts for retracted publications. A faculty member who published in a journal that was later delisted or whose paper was retracted doesn't just lose that publication from the count — the retraction is subtracted as a penalty. A single retracted paper reduces PU further than the absence of one paper would.
QP (40 marks): Citation quality — the largest RP sub-parameter
QP is the largest single sub-parameter in RP, worth 40 marks. The formula: QP = 20 × f(CC/FRQ) + 20 × f(TOP25P/P) − deduction for retracted citations. This breaks into three components: total citations per faculty, percentage of publications in top-25-percentile journals, and a deduction for retracted citations.
The first component (CC/FRQ) rewards citation volume. The second component (TOP25P/P) rewards citation quality — the proportion of your publications that appear in the top quartile of journals in their field. These two components together mean that an institution with fewer but higher-quality publications can outscore an institution with more but lower-quality publications.
The practical implication: institutions that encourage faculty to publish in high-volume, low-impact journals — "predatory" or borderline journals that accept easily but carry low citations — are optimising for PU at the expense of QP. Since QP carries 40 marks versus PU's 35 marks, this is a losing trade.
The institution that publishes 200 papers in mid-tier journals may score lower on RP than the institution that publishes 120 papers in top-quartile journals. Publication count matters. Citation quality matters more.
IPR (15 marks): Patents granted carry more weight than patents published
IPR is scored as IPR = 10 × f(PG) + 5 × f(PP), where PG is patents granted over the previous three years and PP is patents published (filed but not yet granted). The 2:1 weightage between granted and published patents reflects NIRF's emphasis on completed intellectual property, not pending applications.
Many institutions file patent applications to demonstrate research activity but don't pursue them through to grant. This produces PP (5-mark component) but not PG (10-mark component). An institution with 20 published patents and 2 granted patents scores much less than an institution with 5 published patents and 10 granted patents.
The data gap we see most often: patents are filed through individual faculty or through external agencies, and the institutional DCS submission doesn't capture them because the patent office records don't match the institution's name exactly. Patents exist but are invisible in the NIRF data because the institution-patent linkage isn't established in the DCS.
FPPP (10 marks): The smallest sub-parameter with the easiest data losses
FPPP measures the footprint of projects, professional practice, and executive development programmes. It's only 10 marks — the smallest RP sub-parameter — but it's also the one where institutions lose marks most easily through under-reporting.
Sponsored research income, consultancy income, and executive development programme revenue should all be captured in the DCS. In practice, many institutions report only the large, formal grants — missing smaller consultancy projects, testing services, industry training programmes, and government-funded capacity building programmes that qualify under FPPP.
The gap isn't that the institution doesn't do professional practice. It's that the finance office doesn't categorise the income in the way NIRF expects, or that department-level activities never reach the institutional DCS submission. An institution with ₹3 crore in actual professional practice income might report only ₹80 lakh in the DCS — losing marks on a sub-parameter where the evidence already exists but isn't being captured.
The RP question institutions should ask
Not "how do we produce more research?" — that's a 3-5 year institutional development question. The immediate question is: "How much of our existing research output is actually showing up in NIRF's data?"
The gap between real research activity and reported research data is where RP marks leak. Faculty affiliations that don't match. Patents that aren't linked. Consultancy income that isn't categorised. Publications in journals that aren't indexed. Citations that exist in one database but not the one NIRF queries.
Finding those gaps requires comparing your institution's actual research output against what appears in Scopus, Web of Science, and your own DCS submission — publication by publication, patent by patent, project by project. That comparison is institution-specific, data-intensive, and exactly what our NIRF diagnostic covers.
How much of your research is invisible to NIRF?
Our NIRF Diagnostic is a parameter-wise assessment that includes RP gap analysis (publication affiliation audit, patent linkage check, FPPP income reconciliation), benchmarking against ranked peers, and a written report identifying where your data leaves marks on the table.
Learn About the Diagnostic →Frequently Asked Questions
What is the NIRF RP parameter?
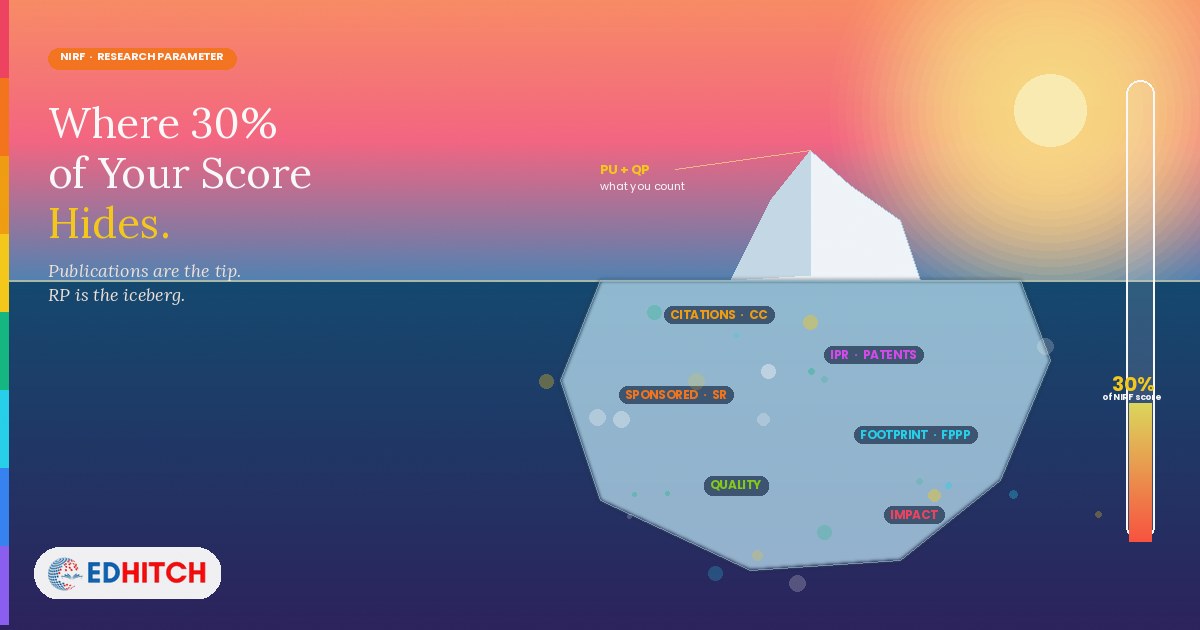
Research and Professional Practice — 30% weightage for Engineering. Four sub-parameters: Publications (PU, 35 marks), Quality of Publications (QP, 40 marks), IPR and Patents (IPR, 15 marks), and Footprint of Projects and Professional Practice (FPPP, 10 marks).
How are publications scored?
PU = 35 × f(P/FRQ). Publications from third-party sources (Scopus, Web of Science) normalised by faculty count (FRQ). Faculty must use correct institutional affiliations for publications to count. The 2025 framework deducts for retracted publications.
What is FRQ?
Faculty Reference Quantity — the greater of nominal faculty (at 1:15 student ratio) or actual faculty. Used as the denominator for PU and QP. Hiring more faculty without increasing publications can dilute your per-faculty rate.
Does NIRF penalise retracted publications?
Yes. The 2025 framework subtracts retracted publications from PU and retracted citations from QP — a double penalty.
Where do institutions lose RP marks most easily?
Data reporting gaps: incorrect Scopus affiliations, unreported patents, under-reported consultancy income, and publications in non-indexed journals. The marks were earned through research activity but lost in reporting.
Related Reading
Edhitch
Accreditation & Ranking Intelligence · NAAC · NBA · NIRF · 12 Years · 100+ Institutions