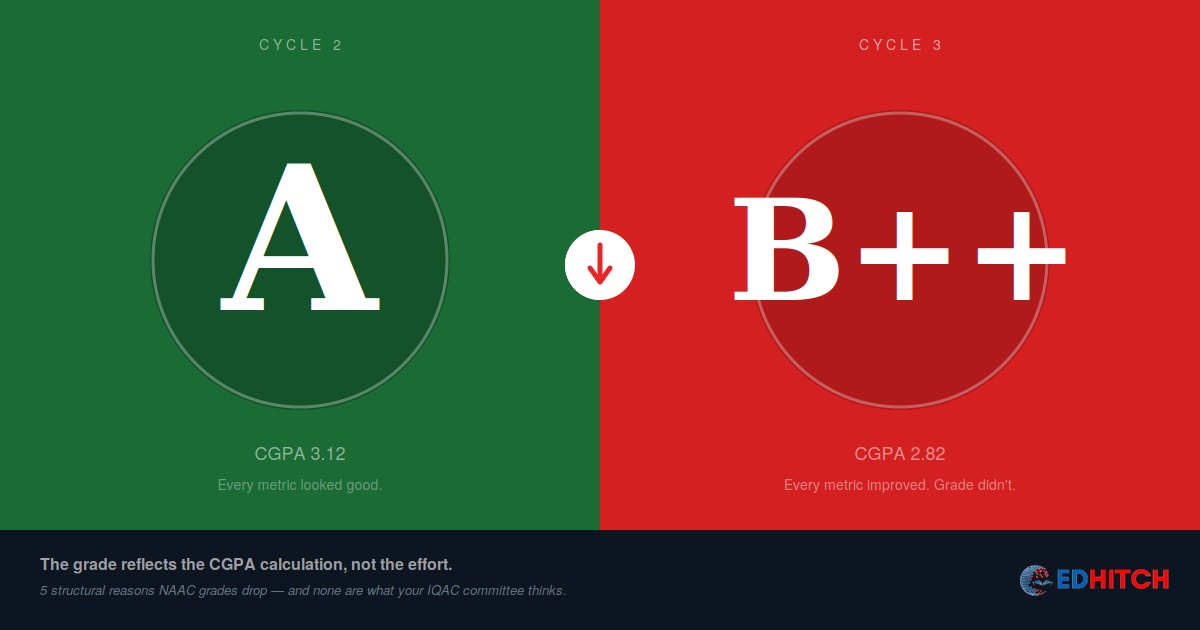
A Principal at a private college in Madhya Pradesh sat across from us with two NAAC certificates on his desk. Cycle 2: A grade. Cycle 3: B++.
In the five years between the two cycles, his institution had added 22 PhD-qualified faculty. Built a ₹6 crore research centre. Published 180 more papers than the previous cycle. Student satisfaction survey scores were up. Placement rates had climbed from 62% to 74%.
"Every number is better," he said. "I can show you the comparison. Faculty: up. Research: up. Infrastructure: up. Placements: up. How did we drop from A to B++?"
He was right that every number was better. He was wrong about what determines the grade.
Your NAAC grade is not a report card. It's a CGPA.
Most institutional leaders read their NAAC grade the way they'd read a school report card: A is good, B is not as good, C is a warning. Improve the underlying work, and the grade should improve.
But a NAAC grade is not a judgment of effort. It is the output of a CGPA calculation — a weighted average of scores across seven criteria, split roughly 70% quantitative metrics (system-generated from your data) and 30% qualitative metrics (assessed by the peer team during their visit). The difference between an A grade (CGPA 3.01) and B++ (CGPA 2.76) is 0.25 points. That's a razor-thin margin — and it doesn't take a catastrophic failure to cross it. It takes a shift in the wrong criterion.
The grade dropped not because you got worse. The grade dropped because the CGPA calculation shifted — and the reasons are almost never what the IQAC committee thinks they are.
Reason 1: DVV deviations silently cut your QnM score
The quantitative metrics that make up ~70% of your CGPA are not simply the numbers you entered in the SSR. They are the numbers after DVV adjustment. Data Validation and Verification cross-checks your claims against supporting evidence, AISHE data, and NIRF submissions. Where deviations are found, your score for that metric is adjusted downward.
Here's what most institutions miss: DVV deviations are not binary pass/fail. They're proportional. If you claimed 85 faculty with PhDs and DVV found evidence supporting only 72, your metric isn't rejected — it's recalculated with 72 as the input. Every metric with a deviation gets quietly corrected. You never see the corrected number until the grade arrives.
A 10-15% deviation across multiple metrics can shift your CGPA by 0.2 to 0.4 points. That's the entire distance between A and B++.
The Principal in Madhya Pradesh had added 22 PhD faculty. But his Extended Profile still carried the old faculty count because it was filled by a different person who used HR's register — which included visiting and contractual faculty. DVV corrected the count downward. Every ratio that used faculty as a denominator shifted.
Reason 2: The peer team scored you differently
The ~30% of your CGPA that comes from qualitative metrics is assessed entirely by the peer team during their campus visit. Different peer teams bring different standards, different expertise, and different areas of focus. This is a known limitation of the current system, and it is real.
An institution that scored 3.5 on Criterion 7 (Institutional Values and Best Practices) in Cycle 2 might score 2.8 on the same criterion in Cycle 3 — not because the institution deteriorated, but because the Cycle 3 peer team had different expectations for what constitutes "best practices." The institution didn't change. The evaluator did.
This creates an uncomfortable reality: part of your grade is determined by who walks through your door, not just by what they find when they get there. Institutions can't control peer team composition. But they can control how clearly they present their qualitative achievements — and most institutions present them poorly.
The peer team spends 2-3 days on campus. If your qualitative achievements aren't visible, documented, and structured for a visitor who has never seen your institution before, they don't exist for scoring purposes.
Reason 3: Your Extended Profile denominators shifted
Between Cycle 2 and Cycle 3, your institution grew. More students, more programmes, more faculty. That growth changes the Extended Profile numbers that serve as denominators in the CGPA calculation.
If you added 500 students but only 8 faculty, your student-faculty ratio worsened. If you added a new PG programme but didn't proportionally increase research output, your publications-per-programme ratio dropped. If expenditure grew 15% but student count grew 25%, your per-student expenditure fell.
The institution improved in absolute terms. Every number got bigger. But the ratios — which are what NAAC actually scores — moved in the wrong direction because the denominator grew faster than the numerator.
This is the most insidious form of grade drop because the internal dashboard shows growth on every metric. The IQAC coordinator reports progress. The VC is satisfied. Nobody checks the ratios until the grade arrives.
Reason 4: Criteria weightage doesn't match your improvement pattern
NAAC's seven criteria do not carry equal weight. The weightage varies by institution type — universities, autonomous colleges, and affiliated colleges each have a different weightage distribution. The details are in the RAF manual for your specific institution category.
The Principal's college had invested heavily in research infrastructure and publications — Criterion 3 (Research, Innovations and Extension). That criterion carries meaningful weight, but his institution is an affiliated college, where Criterion 2 (Teaching-Learning and Evaluation) carries the highest weightage.
His research investment moved a criterion that mattered. But it didn't move the criterion that mattered most for his institution type. Meanwhile, Criterion 2 scores were flat because the teaching-learning improvements hadn't translated into measurable outcome changes — the new faculty were publishing, but student learning outcomes hadn't demonstrably improved in the SSR metrics.
Institutions that improve everywhere equally are institutions that improve nowhere strategically. The CGPA rewards improvement where the weightage is highest — not where the institution is most enthusiastic.
Reason 5: You solved Cycle 2's problems — but Cycle 3 asked different questions
Every NAAC cycle produces a peer team report with observations, weaknesses, and recommendations. The natural institutional response is to spend the next five years fixing everything the peer team flagged. This is logical. It is also a trap.
The RAF manual evolves between cycles. Metric definitions change. Weightages shift. New key indicators appear. The qualitative questions the peer team asks in Cycle 3 are not identical to the ones asked in Cycle 2. An institution that spends five years fixing Cycle 2's weaknesses arrives at Cycle 3 having prepared for the last exam, not the current one.
The more dangerous version: NAAC's increasing emphasis on cross-platform data verification — comparing SSR data against AISHE and NIRF submissions — means that consistency failures that didn't matter in Cycle 2 now trigger DVV flags in Cycle 3. The institution is the same. The scrutiny is higher. Institutions that were strong but whose data discipline was weak are the ones most exposed.
What actually prevents a grade drop
Run a pre-submission DVV audit. Before submitting the SSR, have someone outside the SSR drafting team verify every quantitative metric against its supporting evidence. Check for the six DVV rejection patterns before NAAC finds them for you.
Analyse your previous cycle's criterion-wise scores. Don't look at the overall CGPA. Look at each criterion's contribution. Identify where you actually lost marks versus where you assumed you lost them. The gap between perception and data is almost always larger than institutions expect.
Align improvement to weightage. Check the RAF manual for your specific institution type. Understand which criteria carry the highest weightage. Direct improvement effort proportional to CGPA contribution, not proportional to institutional enthusiasm or peer team recommendations.
Cross-check your Extended Profile ratios, not just your raw numbers. Growth is not improvement if the ratios worsen. Track the ratios between cycles, not just the numerators.
Read the current RAF manual, not the previous one. If a metric definition or weightage has changed since your last cycle, your preparation needs to change too. Don't prepare for Cycle 2's exam.
Not sure why your grade dropped — or worried it might?
Our NAAC Binary Readiness Diagnostic is a four-week, fixed-scope assessment that includes criterion-wise CGPA analysis, DVV risk audit, Extended Profile verification, and a written report identifying exactly where marks were lost and what would recover them.
Learn About the Diagnostic →Frequently Asked Questions
Why did my NAAC grade drop despite improvement?
NAAC grades are CGPA-driven. Grade drops usually trace to five structural causes: DVV deviations reducing QnM scores, different peer team scoring, unfavourable Extended Profile ratio shifts, improvement in low-weightage criteria, or preparing for the previous cycle's questions.
Can the grade drop even if everything improved?
Yes. If improvements concentrate in low-weightage criteria while high-weightage criteria stagnate — or if growth changes your ratios unfavourably — the CGPA can decrease even as raw numbers increase.
How much does DVV affect the grade?
DVV checks the ~70% of CGPA that's quantitative. A 10-15% deviation across multiple metrics can shift CGPA by 0.2-0.4 points — the entire distance between A and B++.
Does peer team composition affect the grade?
Yes. Qualitative metrics (~30% of CGPA) are assessed by the peer team. Different teams bring different standards. This subjectivity is a known limitation of the current system.
How can institutions prevent grade drops?
Pre-submission DVV audit, criterion-wise score analysis from the previous cycle, improvement aligned to weightage not enthusiasm, Extended Profile ratio tracking, and reading the current RAF manual — not the previous one.
Related Reading
- What the DVV Process Actually Checks (And 6 Reasons Clarifications Get Rejected)
- The NAAC Extended Profile, Explained: What Goes Where
- One Nation, One Data — Why NAAC, NBA and NIRF Will Soon Cross-Check Everything
- The Institution Was Strong. The Data Was Weak.
- We Improved Everything. Our NIRF Rank Dropped. What Happened?
- What a NAAC Binary Readiness Diagnostic Actually Tells You
Edhitch
Accreditation & Ranking Intelligence · NAAC · NBA · NIRF · 12 Years · 100+ Institutions