A department head at an engineering college in Andhra Pradesh showed us his CO-PO attainment data. Every PO showed attainment above 60%. The graphs were clean. The tables were formatted. The methodology was documented across four pages.
The evaluator wasn't convinced. Not because the numbers were wrong — they were arithmetically correct. The problem was that every CO was mapped to nearly every PO at strength 3, the target levels were set low enough that almost everything "met" them, and there was no Action Taken Report explaining what the department did when attainment fell short in the previous cycle.
The numbers showed attainment. They didn't show the thinking behind the attainment. And that distinction — between having numbers and having a credible attainment story — is where most NBA programmes lose marks they didn't expect to lose.
The evaluator isn't checking your arithmetic. They're checking your logic.
CO-PO attainment under NBA follows a layered process that most institutions implement correctly at the calculation level but poorly at the reasoning level. The layers are well known: define Course Outcomes (COs) for each course, map COs to Program Outcomes (POs) with strength indicators, measure CO attainment through direct and indirect assessment, aggregate into PO attainment, compare against targets, and document corrective actions.
The arithmetic at each layer is straightforward. What distinguishes a credible SAR from a mechanical one is whether the institution can answer why at every step. Why is this CO mapped to PO3 at strength 2 instead of strength 1? Why is the direct-indirect weightage 80-20 and not 70-30? Why is the target level set at 55% and not 65%? Why did PO5 attainment drop in 2024 and what specifically was done about it?
Institutions that can answer these questions have an attainment system. Institutions that cannot have an attainment spreadsheet. The evaluator can tell the difference within a few minutes of reading the SAR.
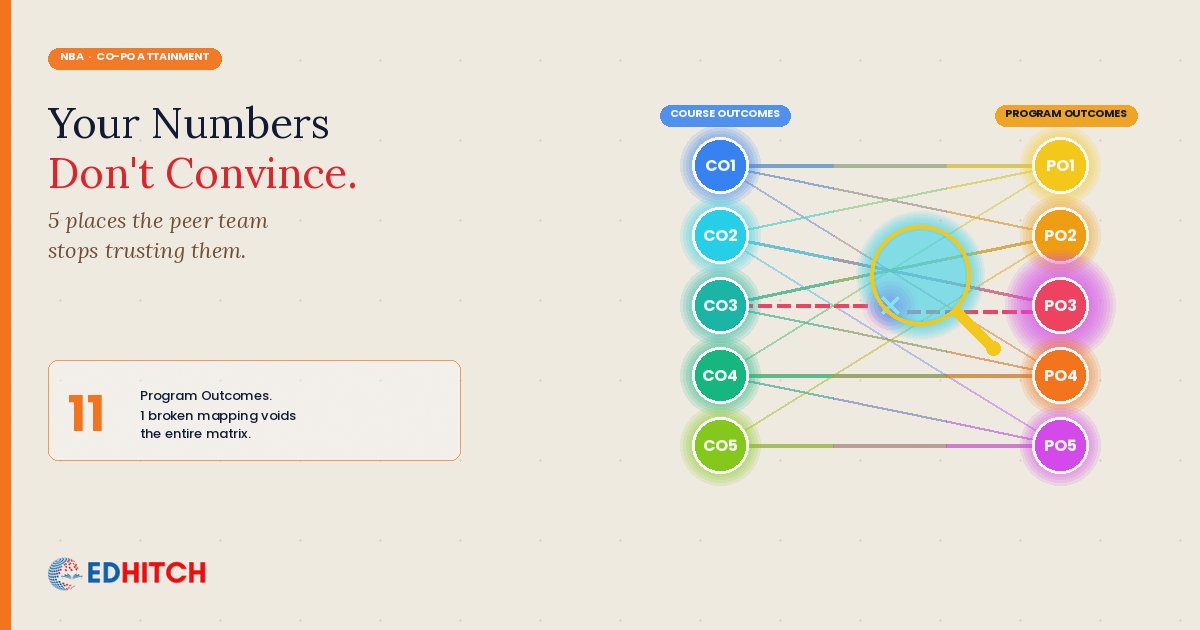
Gap 1: Mapping everything to everything
The most common CO-PO mapping error: every CO in a course is mapped to 8 or 9 of the 11 POs, most at strength 2 or 3. This produces a dense articulation matrix that looks thorough but signals the opposite — it signals that the mapping was done without genuine analysis of what each CO actually contributes to.
A well-designed CO shouldn't contribute to more than 3-5 POs. If a single CO genuinely maps to 9 POs at high strength, the CO is probably too broadly defined — it's a course description, not a measurable outcome. The evaluator looks for selective, justified mapping where each CO-PO link can be explained in terms of specific course content, assessment design, and learning activities.
When an evaluator sees a mapping matrix that's mostly filled with 2s and 3s, the credibility of the entire attainment calculation comes into question — because the inputs to the formula are inflated before the calculation even begins.
Gap 2: Target levels that guarantee success
Target levels are the benchmarks against which attainment is measured. If 60% of students score above the threshold on a CO, the CO is "attained." If the PO's contributing COs are attained above the target percentage, the PO is "attained."
The problem: many institutions set target levels that are nearly impossible to miss. A target of "40% of students scoring 40% or above" will be met by almost every course in almost every year. This produces uniformly high attainment numbers that look good in the SAR but tell the evaluator nothing about quality improvement.
Meaningful target levels should be challenging enough that some COs and POs don't meet them in some years. This isn't a failure — it's the starting point for the continuous improvement cycle that NBA expects to see. An institution where every PO is comfortably attained every year either has genuinely exceptional outcomes or, more commonly, has targets set too low to reveal any gap worth acting on.
The evaluator is more impressed by a programme that shows PO5 fell short at 52%, explains why, documents the corrective action, and shows PO5 improving to 61% in the next cycle — than by a programme where every PO shows 75%+ attainment with no gaps and no actions.
Gap 3: Direct-indirect weightage without justification
Most institutions use a direct-indirect attainment split — commonly 80-20 or 70-30, where direct assessment (exams, assignments, projects) carries the majority weightage and indirect assessment (course-exit surveys, alumni feedback) carries the rest.
The split itself isn't the problem. The problem is that most institutions adopt a ratio without documenting why they chose it. The SAR states "direct assessment: 80%, indirect assessment: 20%" with no explanation of how the institution arrived at this ratio, whether it has been reviewed, or whether it's consistent across all courses and all years.
The evaluator understands that direct assessment is more rigorous than self-reported surveys. But they want to see that the institution made a deliberate decision about the weightage, not that it copied a ratio from another institution's SAR or a consultant's template.
Gap 4: Attainment without Action Taken Reports
This is the gap that costs the most marks. Institutions invest considerable effort in calculating attainment — building spreadsheets, producing graphs, formatting three-year trend charts. But the calculation is only half the requirement. NBA's evaluation framework expects a complete cycle: measure → identify gaps → take action → measure impact.
An ATR for CO-PO attainment should document: which POs fell below target, why (based on analysis of contributing COs and assessment data), what specific action was taken (not "faculty were advised to improve teaching" but "a workshop on embedded systems was added to the Semester 6 curriculum to address PO5 shortfall"), and what happened to attainment in the subsequent cycle as a result of that action.
The most common pattern we see: attainment graphs showing year-on-year improvement without any corresponding ATR. The improvement may be real — but without documented corrective actions, the evaluator has no evidence that it was intentional. Improvement without documented cause looks like data manipulation to an experienced evaluator.
Gap 5: Inconsistent methodology across courses or years
A programme with 40 courses across 8 semesters needs a consistent CO-PO methodology across all of them. When Course A uses a 3-level mapping scale, Course B uses a binary (mapped/not mapped) approach, and Course C uses a different threshold for CO attainment, the resulting PO attainment numbers are aggregated from incompatible data.
The evaluator checks for methodological consistency by sampling — comparing the attainment calculation methodology across 3-4 courses from different semesters and different years. If the sampling reveals inconsistency, the credibility of the entire attainment system is questioned.
Consistency also means consistency over time. If the direct-indirect ratio was 80-20 in 2023 and changed to 70-30 in 2024 without explanation, the three-year trend data loses meaning — because the comparison isn't apples to apples.
The real question the evaluator is asking
The evaluator is not asking "did you calculate attainment?" Every programme calculates attainment. The evaluator is asking: "Does your attainment system actually drive improvement in your programme?"
A programme that can show the evaluator a specific instance where attainment data revealed a gap, a specific corrective action was taken, and subsequent data shows the gap narrowing — that programme demonstrates that OBE is functioning, not just documented. That's what convinces the evaluator.
Whether your programme can demonstrate that cycle — and where the gaps are in your current attainment system — depends on your specific data, your mapping logic, your target-setting rationale, and your ATR documentation. Those gaps are programme-specific. They require programme-specific analysis.
Want to know if your CO-PO system will convince the evaluator?
Our NBA Readiness Diagnostic includes CO-PO mapping review, attainment methodology audit, ATR gap analysis, and criterion-wise scoring assessment against GAPC v4.0 thresholds.
Learn About the Diagnostic →Frequently Asked Questions
How is CO-PO attainment calculated?
In layers: CO attainment from direct (exams, assignments — typically 70-90% weight) and indirect assessment (surveys — 10-30%). COs are mapped to POs with strength indicators (1-2-3). CO attainment is multiplied by mapping strengths, aggregated across courses to produce PO attainment. Compared against targets. Gaps documented with corrective actions.
What are the most common mistakes?
Five patterns: mapping every CO to every PO at high strength, setting targets too low to reveal gaps, adopting direct-indirect ratios without justification, producing attainment numbers without ATRs, and inconsistent methodology across courses or years.
What's the difference between direct and indirect attainment?
Direct = student performance on assessments mapped to COs. Indirect = student self-reported perception of CO achievement (surveys). Direct carries higher weightage because it's demonstrated performance, not self-report.
What does NBA expect in ATRs for attainment?
A documented cycle: measure attainment, identify specific gaps, take specific corrective action, show impact in subsequent data. "PO5 was 52%, we added a Python module, PO5 rose to 61%" is evidence. A rising graph without explanation is not.
How many POs under GAPC v4.0?
11 Program Outcomes for engineering programmes (reduced from 12), with stronger emphasis on sustainability, ethics, and complex engineering problems aligned with Washington Accord 2021.
Related Reading
Edhitch
Accreditation & Ranking Intelligence · NAAC · NBA · NIRF · 12 Years · 100+ Institutions