Most engineering institutions know that NBA Criterion 3 carries 175 marks — the largest single criterion in the SAR. Most also know that within Criterion 3, the Course Articulation Matrix is the central document. What's less widely understood is what NBA peer teams actually look for when they open one of these matrices.
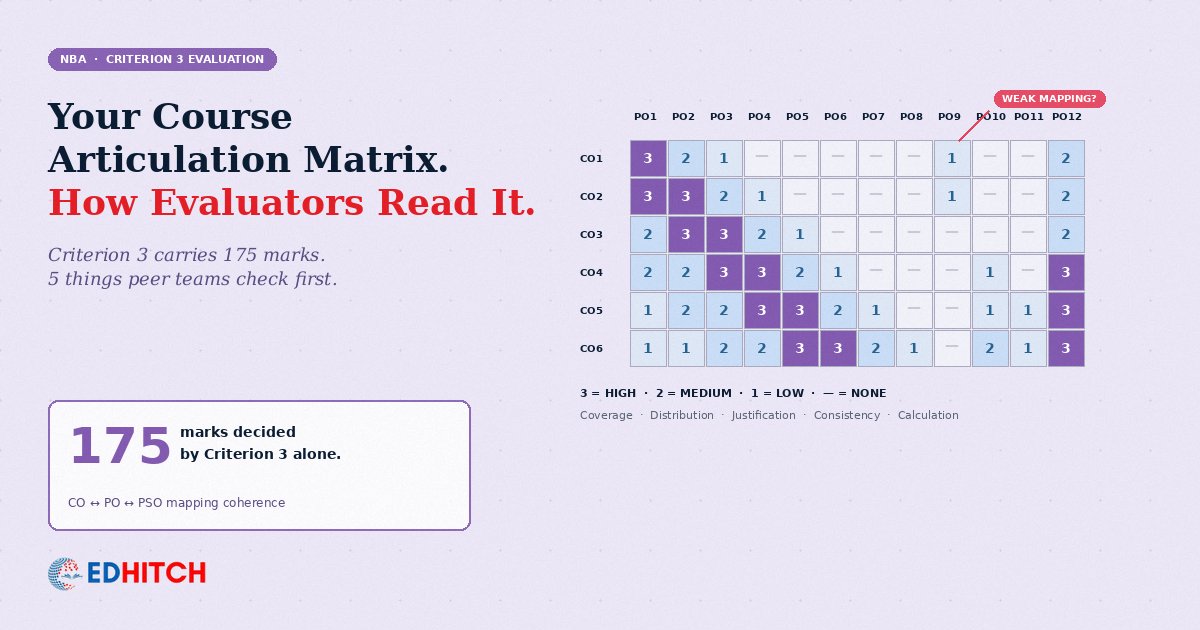
The matrix itself is straightforward enough — courses on one axis, Programme Outcomes (POs) and Programme Specific Outcomes (PSOs) on the other, correlation levels filled in using NBA's standard 3-2-1 scale (3 = High, 2 = Medium, 1 = Low, blank = none). Six to ten matrices required, at least one per semester, six course outcomes per course, mapped to twelve POs and the programme's PSOs.
That much is in NBA's published Tier I manual. What's not in the manual is what evaluators look at first — and what they decide is hiding behind a polished-looking matrix.
What evaluators actually check, in order
From engagements where we've observed NBA peer team reviews, the evaluation pattern is consistent. Evaluators check five things, roughly in this order:
1. Coverage
The first scan is breadth. Does the matrix have entries against all 12 POs, or are some POs untouched across the entire programme? If PO 7 or PO 8 (the ones around sustainability, ethics, lifelong learning — the "softer" outcomes that engineering programmes historically underweight) show as empty columns or trivially weak, evaluators note it immediately. The matrix is supposed to demonstrate that every PO is genuinely addressed somewhere in the curriculum. Empty columns suggest the programme isn't producing what NBA expects.
2. Distribution
The second scan is shape. Is the correlation density realistic? Programmes that show 3s in every cell are immediately suspect — no course addresses every outcome at high correlation. Programmes that show only 1s and 2s are also suspect, because they suggest the programme doesn't strongly produce any of the POs. The natural shape of a credible matrix is a mix: some high-correlation cells where a course directly produces an outcome, some medium-correlation cells where it contributes, and many empty cells where the course doesn't materially address that outcome. Matrices that look too clean tend to be too neat.
3. Justification
Where the matrix shows a correlation, can the institution justify it? NBA's guidance says justification should reference the COs, the POs, and the course syllabus. Evaluators sample a few cells — typically one course per year of study — and ask the programme team to defend the correlation level. "Why is this mapped 3? Where in the syllabus is this outcome demonstrably produced?" Institutions that can answer with specific syllabus elements pass this check. Institutions that produce general explanations or struggle to identify the specific content lose marks.
4. Consistency
The fourth scan is across documents. The Course Articulation Matrix has to align with the Programme Articulation Matrix, which has to align with the assessment processes, which has to align with the attainment data. When an institution shows a course strongly mapped to PO 4 in the matrix but its assessment processes don't produce attainment data for PO 4, evaluators flag the inconsistency. The matrix isn't a standalone artefact; it's a hinge that has to connect with everything else in Criterion 3.
5. Calculation
The fifth scan is into the attainment computation. When CO-PO correlations are aggregated to produce PO attainment levels, the maths has to work — and it has to be transparent. Evaluators check the formula being used, the way correlation levels are weighted, and whether the resulting PO attainment numbers are plausible given the underlying course-level data. Institutions using opaque "black box" calculation methodologies tend to lose marks here, regardless of how good the matrix itself looks.
The patterns evaluators flag as "constructed"
Beyond the five checks above, peer teams have a sense — built up across hundreds of programme reviews — for matrices that have been "constructed" rather than "derived." A few signals:
- Uniform correlation levels across courses. When every course in a programme shows similar correlation patterns, the matrix looks copy-pasted rather than course-specific. Real courses vary widely in what they actually produce.
- PSO coverage that doesn't match the programme's claimed specialisation. A computer science programme claiming PSOs around "applied software development" should show courses producing that outcome at high correlation — and many should. When PSO coverage is thin, it suggests the PSOs were defined aspirationally rather than from actual programme content.
- Missing or perfunctory PSO mapping for elective courses. Electives are where programme specialisation lives. Matrices that show electives mapping weakly to PSOs suggest the elective structure doesn't actually produce the specialisation the programme claims.
- Mathematical impossibilities in attainment calculation. When the aggregated PO attainment exceeds what the underlying CO data could support, or when CO attainment is reported above 100% of course capacity, evaluators see manipulation.
What the strongest matrices share
Programmes that score well on Criterion 3 tend to share a few characteristics in their matrices:
They show realistic distributions — most cells empty, some at correlation 1 or 2 (the course contributes), fewer at 3 (the course centrally produces this outcome). They show variation across courses — different courses have different correlation patterns because different courses produce different outcomes. They show traceable PSO coverage — the programme's claimed specialisation is reflected in which courses centrally produce the PSO-aligned outcomes. They produce attainment data that aggregates plausibly — the maths works and is defensible.
And they reflect work done over time, not work done before the visit. A strong matrix is the byproduct of a programme that has internalised outcome-based education at the operational level — where faculty teaching a course can actually point to which week's content produces which CO, which assessment item measures it, and how the resulting data feeds back into improvement. A weak matrix is the byproduct of an OBE process that happens once a year on paper rather than continuously in classrooms.
Want a diagnostic read of where you stand?
Edhitch runs an Accreditation Diagnostic across NIRF, NAAC, and NBA — surfacing the gaps that don't show up on your dashboard.
See the Diagnostics Catalogue →What this means for institutions in SAR preparation
If your programme is preparing a Tier I SAR for the next NBA cycle, the work isn't to produce a polished Course Articulation Matrix. It's to ensure that the matrix you produce honestly reflects what your programme actually does. Evaluators see through polish quickly; they're harder to fool than the documentation makes them look.
The institutions that score well on Criterion 3 don't construct better matrices. They run programmes whose actual operations produce defensible matrices as a natural consequence. The matrix is a downstream artefact of upstream programme reality. Trying to fix the matrix without fixing what it reflects almost always shows.
About Edhitch
Edhitch is an independent accreditation and ranking diagnostics firm working with Indian higher education institutions. Twelve years in the sector. 100+ institutions served. A seven-year NIRF dataset spanning 5,076+ institution-year records across 13 disciplines. Founder-led advisory combining proprietary diagnostic software with strategic engagement. Read more about us →