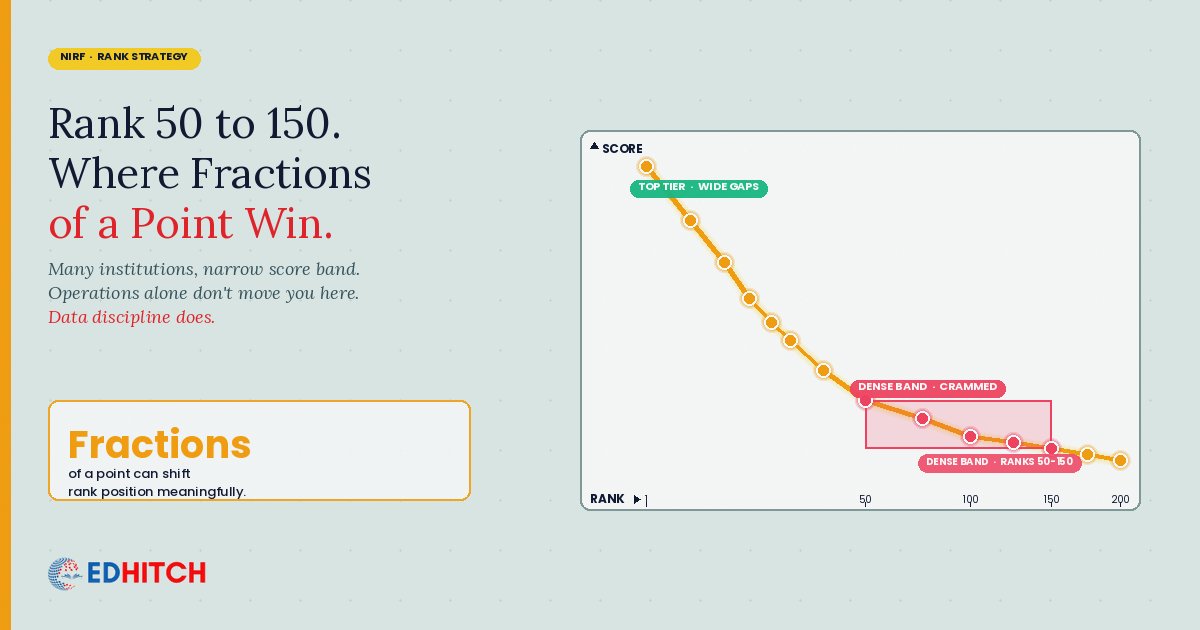
Look at any year's NIRF Engineering rankings between positions 1 and 200. The pattern is unmistakable: as you move down the rank order, the score gap between adjacent ranks shrinks. By the time you reach the band between rank 50 and rank 150, institutions are separated by fractions of a point. By rank 150 to 200, the gaps can be smaller than 0.1.
This has consequences institutional leaders rarely appreciate.
An institution holding the same score year-on-year can drop several ranks because the cohort below it improved slightly. An institution making a small operational improvement can climb meaningfully because it crossed the threshold of a few institutions clustered just above it. Neither movement reflects what most boards interpret it to mean.
This is the most misunderstood feature of NIRF rankings. It explains more institutional misallocation of resources than any other single factor.
What score compression looks like in the data
Pull the NIRF 2025 Engineering rankings (released September 4, 2025). Look at the scores from rank 1 through rank 200. The shape is recognisable:
- Top tier (ranks 1-10): scores typically span a wide range, with meaningful gaps between adjacent ranks
- Upper-middle (ranks 11-50): scores still spread enough that single-rank movements reflect real score differences
- Middle band (ranks 51-100): scores compress noticeably — institutions are crowded into a tighter range
- Dense band (ranks 101-150): scores compress further — many institutions cluster within a small score range
- Lower band (ranks 151-200): the densest stretch, where institutions are separated by fractions of a point
The exact spreads vary by category and year, but the pattern is consistent across NIRF's history: as you move down the rank order, the score spread narrows. By the time you reach the 100-200 band, many institutions sit within a small score range.
What does that mean in practice? It means the gap between two ranks several positions apart may be a single point of NIRF score — and a single sub-parameter improvement can move an institution multiple positions. It also means small data errors, missing offer letters, or one disputed publication can drop an institution similarly in the other direction.
In the dense band, NIRF rank can be more sensitive to data quality than to operational quality.
Why the compression exists
Three structural reasons:
One: NIRF's parameters reward absolute performance up to a ceiling. Once institutions cross certain thresholds — minimum publication count, minimum placement rate, baseline infrastructure — the marginal scoring on those parameters compresses. The top 50 institutions distinguish themselves on rare excellence (Nobel-tier research, exceptional employer networks, internationalisation). The 50-200 band has crossed the baselines but isn't producing rare excellence — they're producing competent performance, and competent performance is hard to differentiate.
Two: Self-reported data normalises around expected values. Institutions know what NIRF measures. They optimise for those measurements. Once everyone in a competitive band is responding to the same parameters, the scores converge. The dense band is a signature of optimisation, not necessarily of similar academic quality.
Three: NIRF's normalisation methodology — using percentile rankings and category-specific scaling — pulls scores towards the middle. The mathematical effect is that the largest gaps are at the extremes (very top and very bottom) and the middle compresses.
The compression isn't a flaw. It is largely a consequence of how the system is designed. Understanding this changes how an institution should respond to its rank.
The strategic misreads compression produces
Three patterns we see consistently from institutions in the 50-150 band:
The "narrow improvement, big climb" misread. An institution improves one or two specific data points — adds publications, increases placement reporting completeness, fixes a financial classification — and climbs noticeably in rank. Leadership concludes that this narrow intervention is the path to further climbing. The next year they invest more in the same narrow area and discover diminishing returns.
The reason: the first-time gain came from moving from "below threshold" to "at threshold" on a parameter where the institution was previously losing easy marks. Once at threshold, further investment delivers far less rank movement because the institution is now competing in the dense band where the marginal score gain is small.
The "we held steady" misread. An institution looks at year-over-year score and sees little change. Leadership concludes operations are stable. The actual outcome — slipping several ranks while holding score — gets attributed to "other institutions improving" and dismissed.
The reason: in a dense band, holding score is losing ground. The cohort is moving. Static performance equals relative decline. The institutions ranked just above and just below your current position are the ones whose movement matters — and they're the ones to benchmark against, not the institutions ranked 50 positions away.
The "marginal cost feels infinite" frustration. An institution invests significantly — new research centre, faculty hiring, infrastructure upgrade — and sees only modest rank improvement. The intervention costs several crore and moves them a handful of positions. Leadership questions whether NIRF investment is worth it.
The reason: large structural investments take several years to register fully in NIRF data. The first year of a new research centre produces almost no NIRF impact. By year four, when faculty publications mature and grant money flows through, the impact compounds. Institutions evaluating NIRF investment on annual rank movement are reading the wrong signal.
What actually moves institutions in the dense band
From Edhitch's seven-year NIRF dataset (5,076+ institution-year records across 13 disciplines), institutions that climbed substantially over consecutive years tend to share three patterns:
Pattern 1: Forensic data quality, not parameter optimisation
The institutions that moved meaningfully in 2-3 years often did not add new programmes or build new infrastructure. They cleaned up their existing data. Affiliation alignment in Scopus. Offer letter archives. PhD register reconciliation. Research grant documentation. They found the marks they were already earning operationally but losing to data presentation issues.
In a dense band, recovering even a fraction of a point of score from data hygiene can move an institution noticeably. The intervention is operational discipline, not strategic investment.
Pattern 2: Cross-framework data integration
The same institutions also reconciled their NIRF, NAAC, and AISHE submissions. When the One Nation One Data infrastructure started cross-referencing, their data held up. Institutions that hadn't reconciled saw scores reduce automatically when cross-checks flagged inconsistencies.
This is not purely future-tense. NIRF 2025 already incorporated some AISHE cross-checking. NIRF 2026 will likely incorporate more. Institutions that built reconciliation capability before it was forced often score marginally higher than peers with similar operations but disconnected data.
Pattern 3: Faculty publication portfolio rebalancing
This is the most counterintuitive pattern. Institutions that climbed often did not just publish more — they restructured the distribution of their publications. Specifically, they reduced concentration of publications in 2-3 prolific faculty members and increased distribution across the regular faculty pool.
NIRF's PU and QP calculations are normalised against the institution's faculty count (FRQ). When publications are concentrated in a small number of faculty, the rest of the regular faculty pool drags the per-faculty average down. An institution where 30 faculty contribute to research can score better on these normalised metrics than one where 5 faculty produce the same volume — because broader research participation reads as institutional research culture, not individual exceptionalism.
The intervention: structured research mentorship for non-publishing faculty, internal grant programmes that prioritise first-time publishers, and explicit redistribution of research time allocation. None of this looks dramatic. But it tends to show up in NIRF metrics over time.
What doesn't move institutions in the dense band
Three commonly-recommended interventions that produce minimal NIRF rank movement:
Marketing and visibility campaigns. NIRF's Perception (PR) parameter is small (typically 10% weighting), and PR is heavily influenced by an institution's existing reputation among peer institutions and employers. Institutions in the 50-150 band rarely have access to the perception networks that move PR scores. Marketing investments produce admission-cycle benefits, not NIRF movement.
New programme launches. Adding a new programme expands intake but doesn't directly improve NIRF score. The new programme dilutes faculty-student ratio in early years (negative impact) and contributes to research output only after multiple cycles. Institutions launching programmes for NIRF gain are usually disappointed.
Infrastructure expansion. Building new buildings, expanding labs, or adding facilities affects only specific NIRF sub-parameters (FRU, infrastructure metrics). The score impact is typically modest and spread over multiple years — meaningful but slow, and easily offset if other parameters slip.
The practical implication for institutions in the dense band
If your institution ranks between 50 and 200 in your category, three priorities matter more than the parameter-improvement workshops most consultants offer:
One: Audit your existing submission for silent errors. The marks you're already earning but losing to data presentation. Affiliation cleanup, offer letter archives, PhD count reconciliation, financial reclassification.
Two: Reconcile your data across frameworks before automated cross-checking forces it. NAAC, NIRF, AISHE, NBA — all reading from a single canonical record.
Three: Distribute research output. Move from 5 prolific faculty producing all the publications to 30 contributing faculty. The structural change takes 18-24 months but compounds in NIRF scoring far more than incremental publication count.
None of these moves are visible from outside. They don't make for press releases. They don't justify big budget asks. But they're what actually moves institutions through the dense band.
Stop optimising for parameters. Start auditing for marks already lost.
Edhitch's NIRF diagnostic reads your last submission with our seven-year benchmarking dataset (5,076+ institution-year records). We identify the silent errors costing you rank in the dense band — affiliation, offer letters, faculty distribution, cross-framework gaps.
Run a NIRF rank diagnostic →What rank actually means in 2026
For institutions outside the top 50, NIRF rank is increasingly a measure of data quality and reporting discipline alongside academic excellence. This is uncomfortable but largely accurate. Two institutions with similar academic operations can rank a meaningful distance apart based on how cleanly each presents its data.
Institutions that recognise this and invest in data quality tend to move steadily upward. Institutions that keep treating NIRF primarily as a measure of academic quality are often surprised by their rank.
The question is not whether NIRF is fair. The question is whether your institution is positioning itself to perform on the actual game NIRF measures — which, in the dense band, leans toward operational data discipline alongside academic transformation.
When NIRF 2026 lands, institutions that had a head start on data discipline will be in a stronger position. Institutions still optimising primarily for parameters in a band where parameters compress will face the same conversations about rank movement they have had for years.
About Edhitch
Edhitch is an independent accreditation and ranking diagnostics firm working with Indian higher education institutions. Twelve years in the sector. 100+ institutions served. A seven-year NIRF dataset spanning 5,076+ institution-year records across 13 disciplines. Founder-led advisory combining proprietary diagnostic software with strategic engagement. Read more about us →