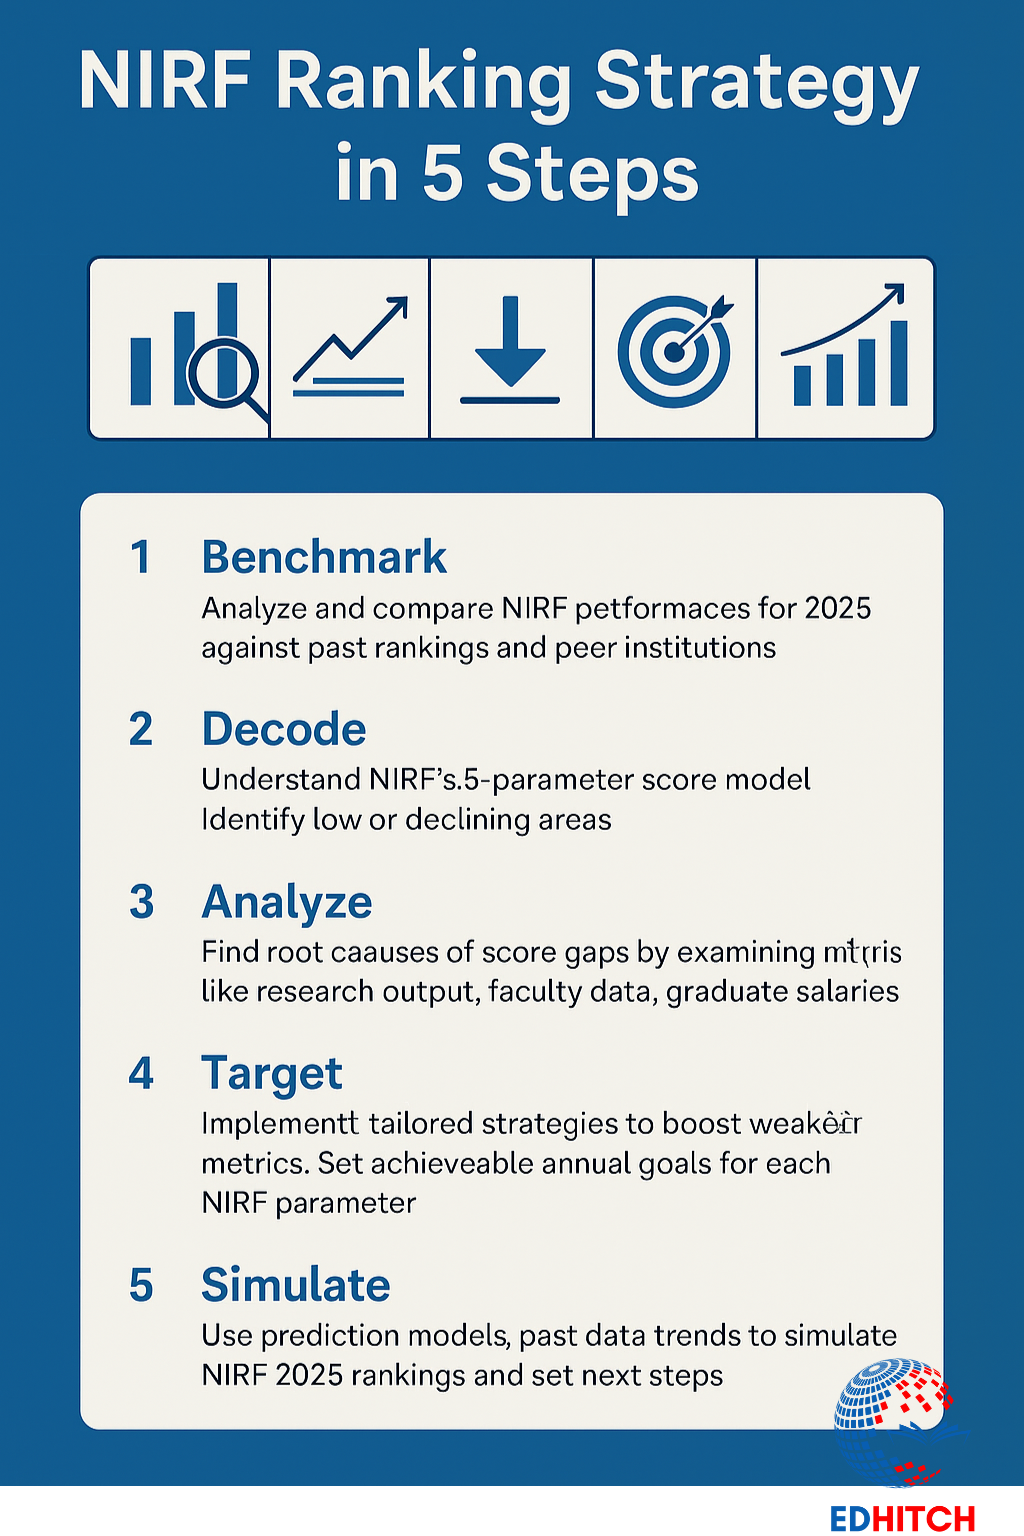
Decode your NIRF scores, benchmark against top institutions, and build a strategy that works.
Opening Scenario:
Your institution applied for NIRF. The rank is out — and it’s lower than expected. Your research score dragged it down. Perception is barely measurable. And now, the management wants a clear improvement plan. Sound familiar?
Automation Insight: Use internal dashboards that mimic NIRF’s calculation formulas so you can view live scores with your institution’s real data.
Q1: When is the best time to begin NIRF preparation?
A: Immediately after the current year’s submission — it’s a continuous process.
Q2: How can perception be improved?
A: Target alumni, recruiters, and other academics with consistent brand outreach.
Q3: What’s the fastest metric to improve?
A: Graduation Outcomes and TLR can show results within 6–12 months.
Q4: How can automation help?
A: Dashboards reduce manual effort, flag gaps, simulate rank bands, and track documentation.
NIRF is about long-term institutional growth — not just scores. Use data, benchmarking, and simulation tools to ensure you're always improving — not just reporting.
Want to decode your NIRF performance? Book a free demo of our AI-based NIRF benchmarking and simulation platform today.
📥 Book Demo